
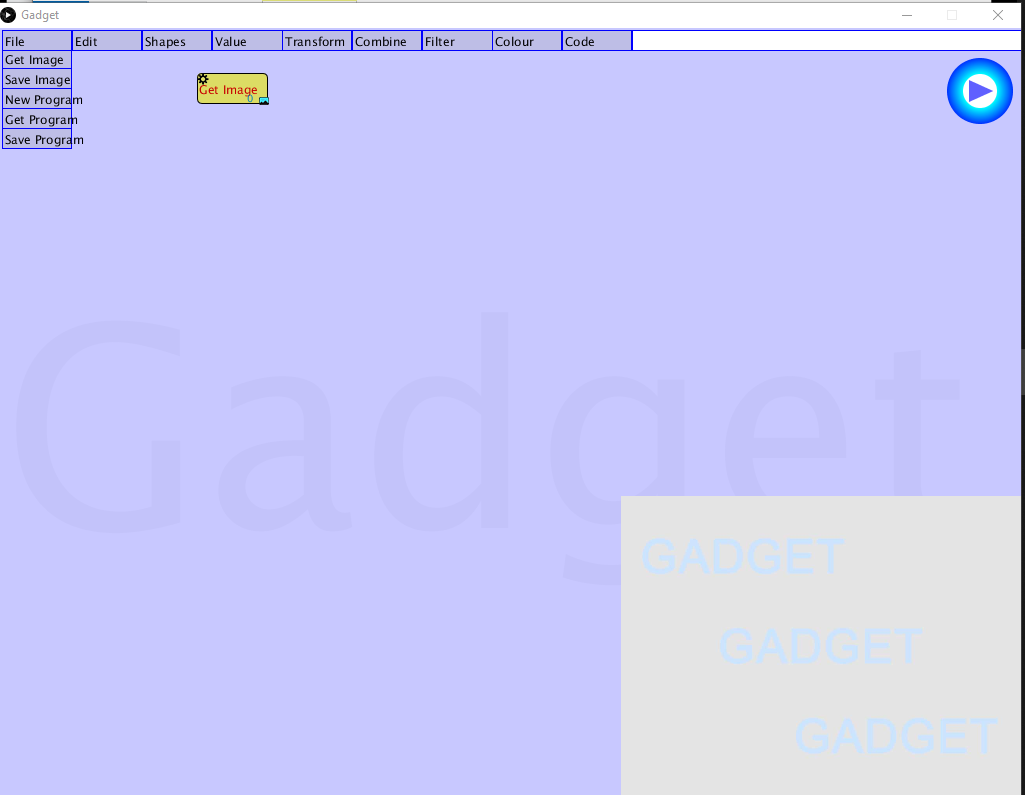
The operations shown are "Get image" (Read an image from a file), "Save image" (save the image that appears in the canvas), "New Program" (clear the nodes from the screen and start again), "Get program" (read a set of nodes from a file), and "Save program" (Save this set of nodes into a file). These are essential bookkeeping operations.
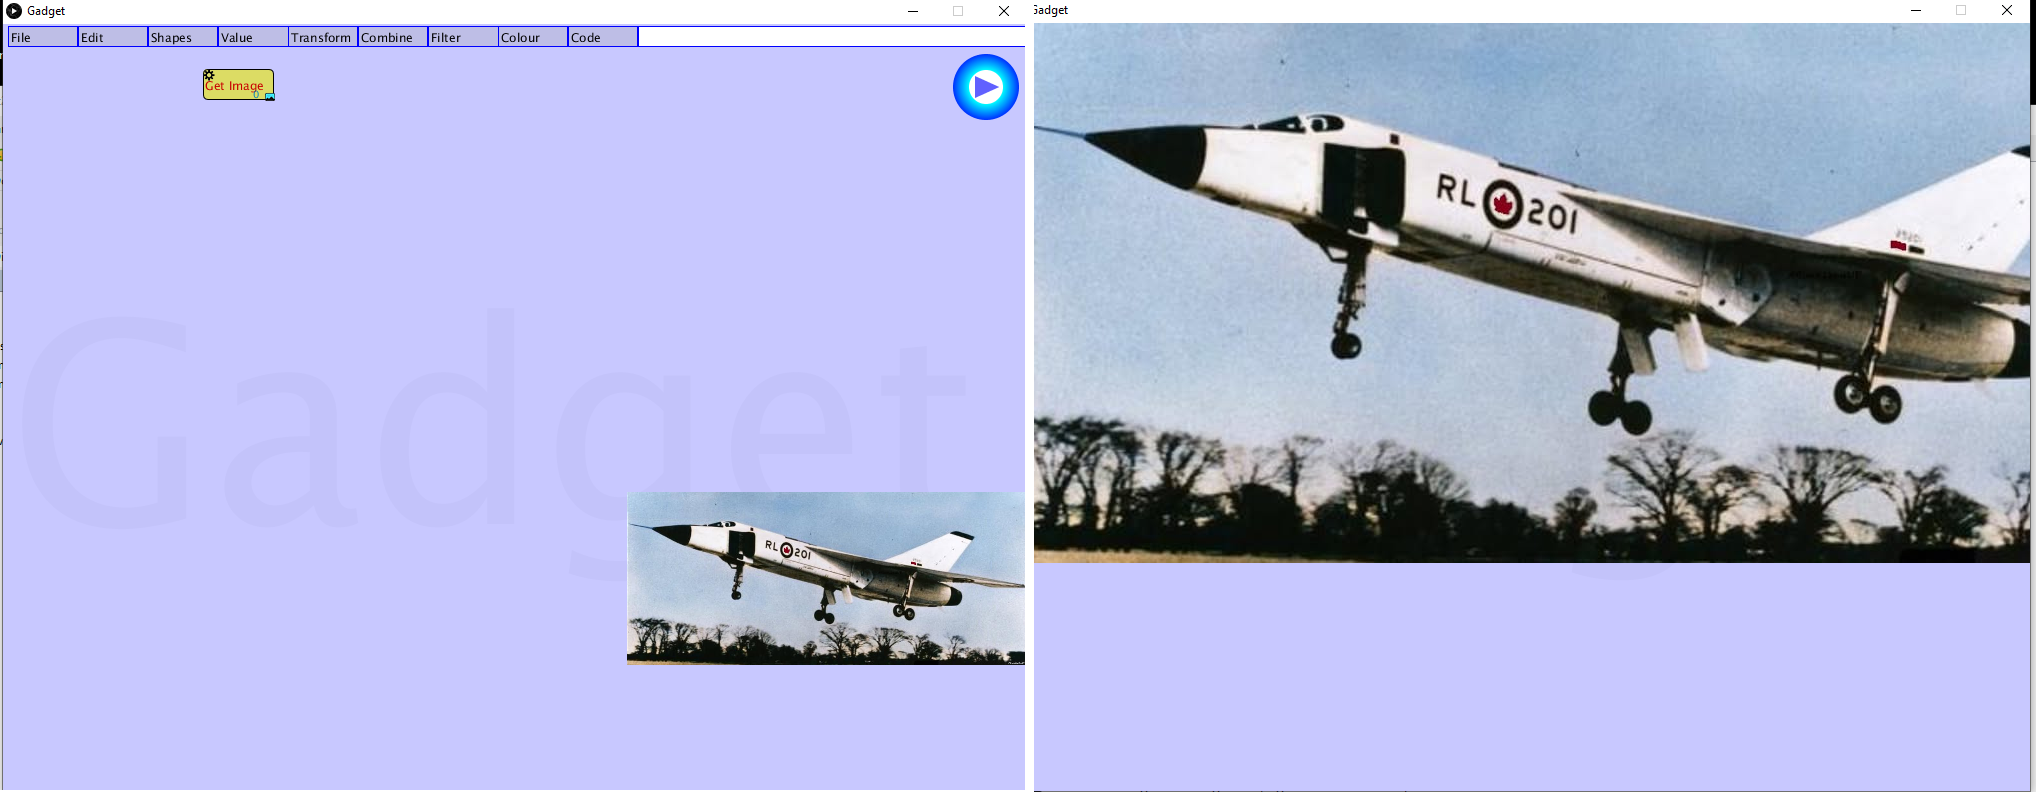
The initial window has within it a box, which we call a node, that is labelled
"Get image".
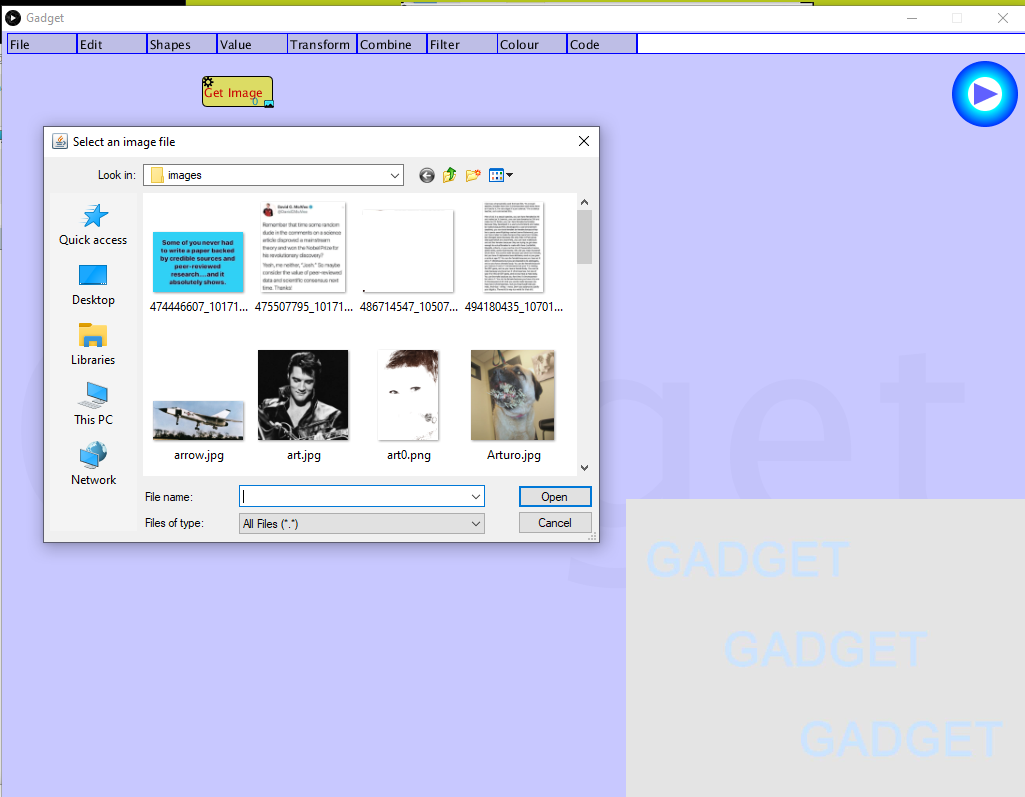
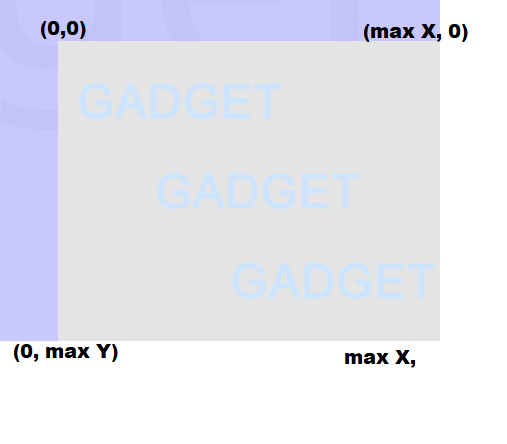
Double click on any image to load it. The image will appear in the canvas in
the lower right or the window.This is where all results will be displayed. If you click
on this image, it will be expanded to fill the window.
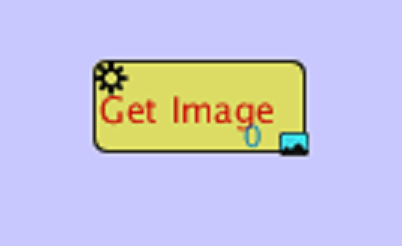
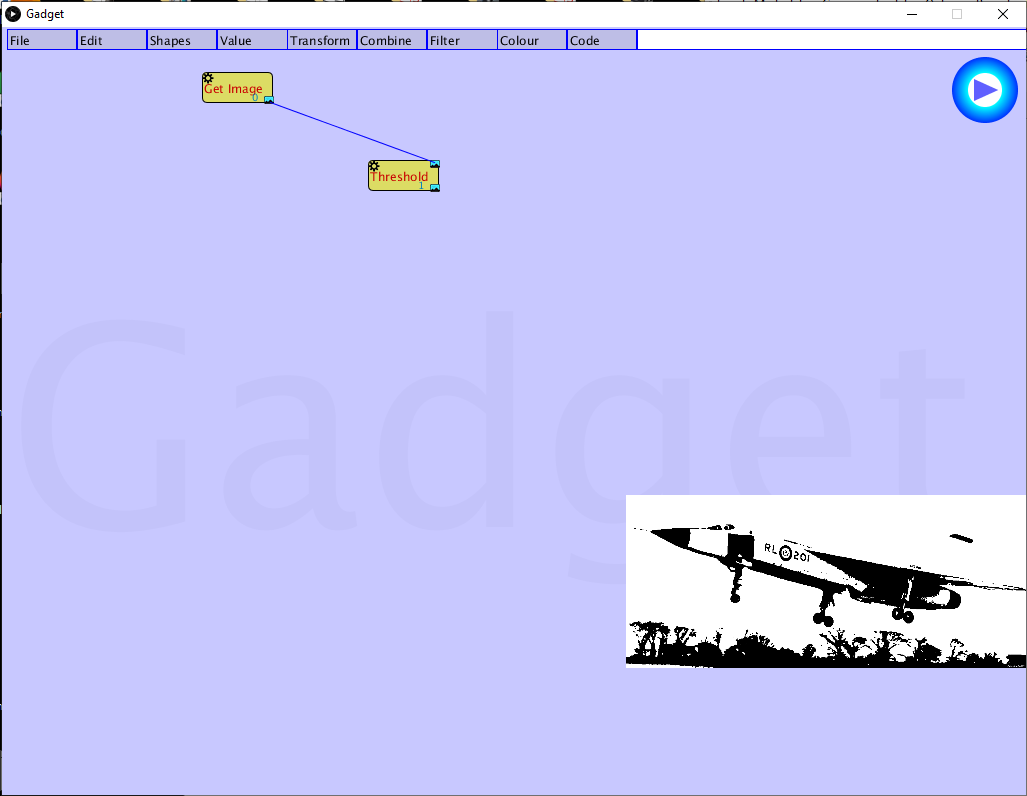
Now look at the lower right of the Get image node. There is a small blue image that
turns red when the mouse is positioned over it. This is the output from that node, which in
this case will be an image, and the region in the node will be called the output connector.
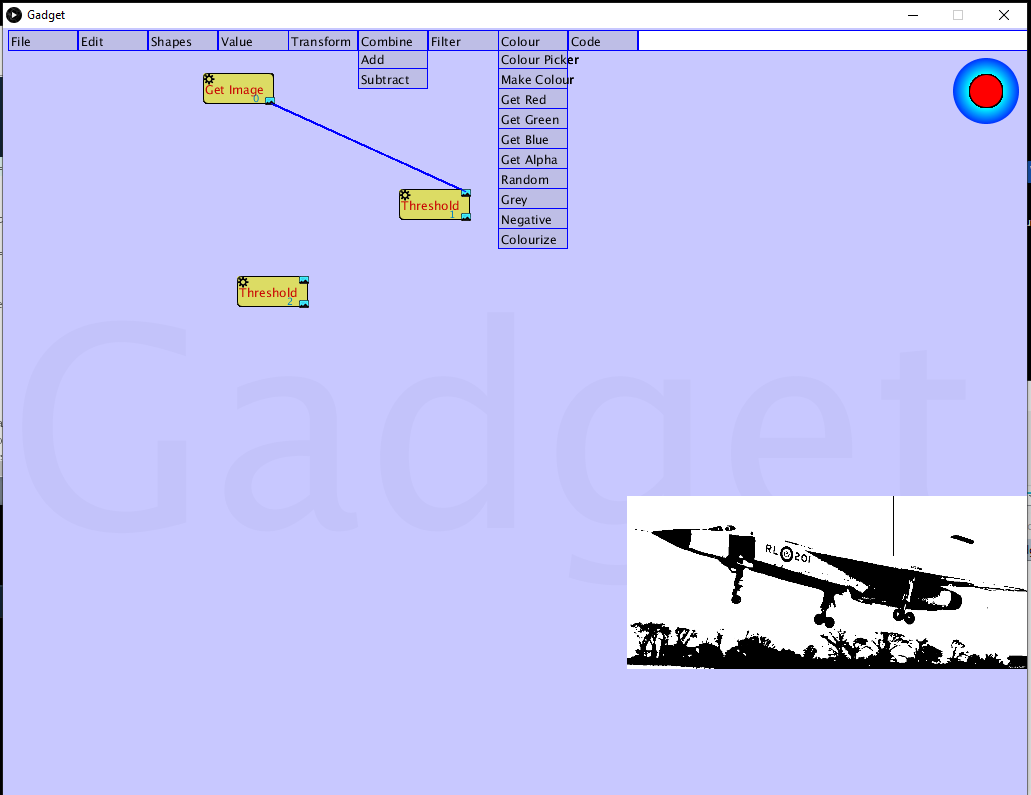
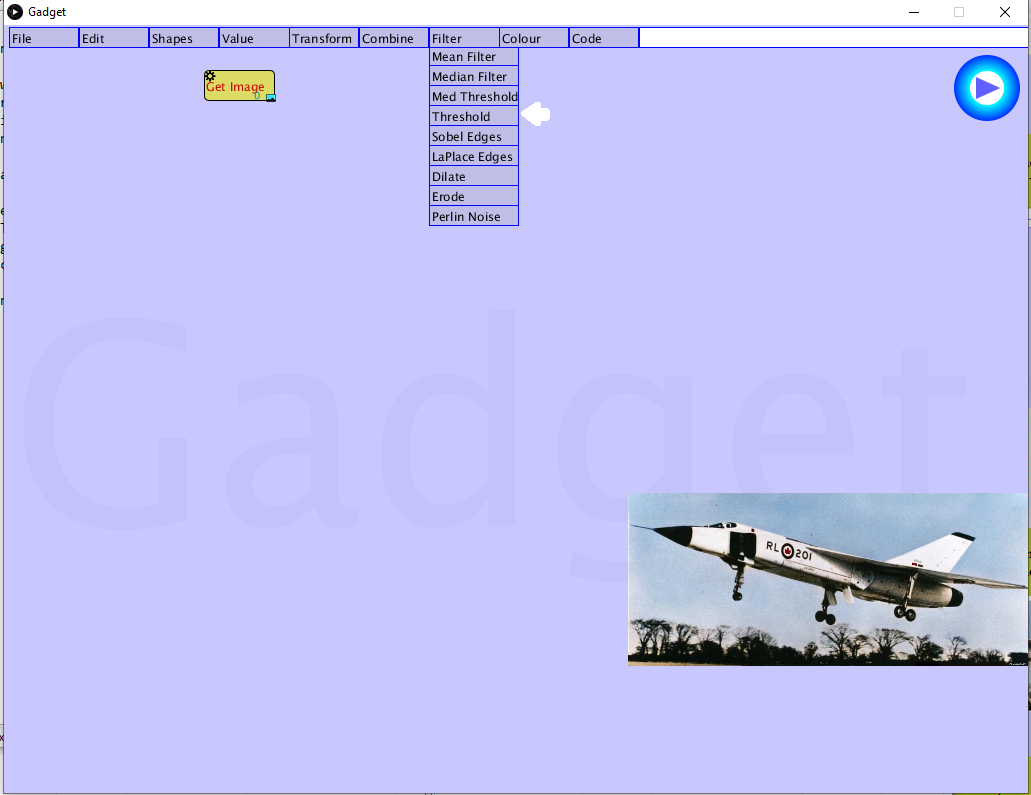
We cen feed this image into another node using the mouse. We don't
have any other nodes yet, so let's make one. Place the mouse over the Filter
menu and select "Threshold".
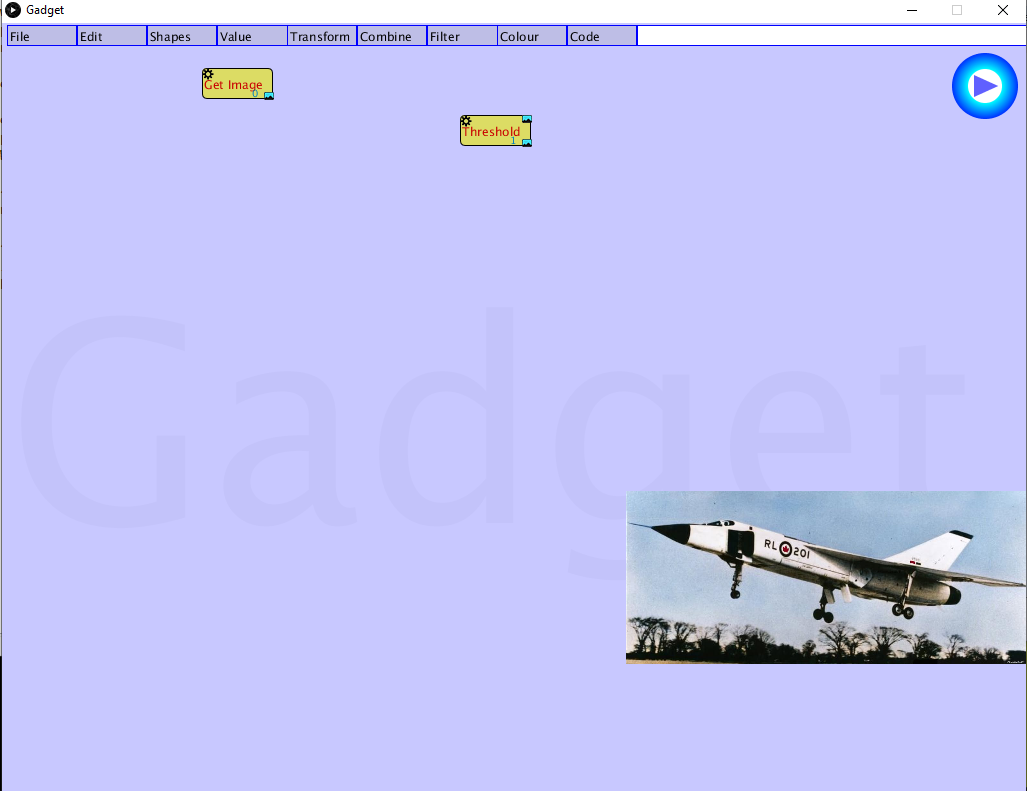
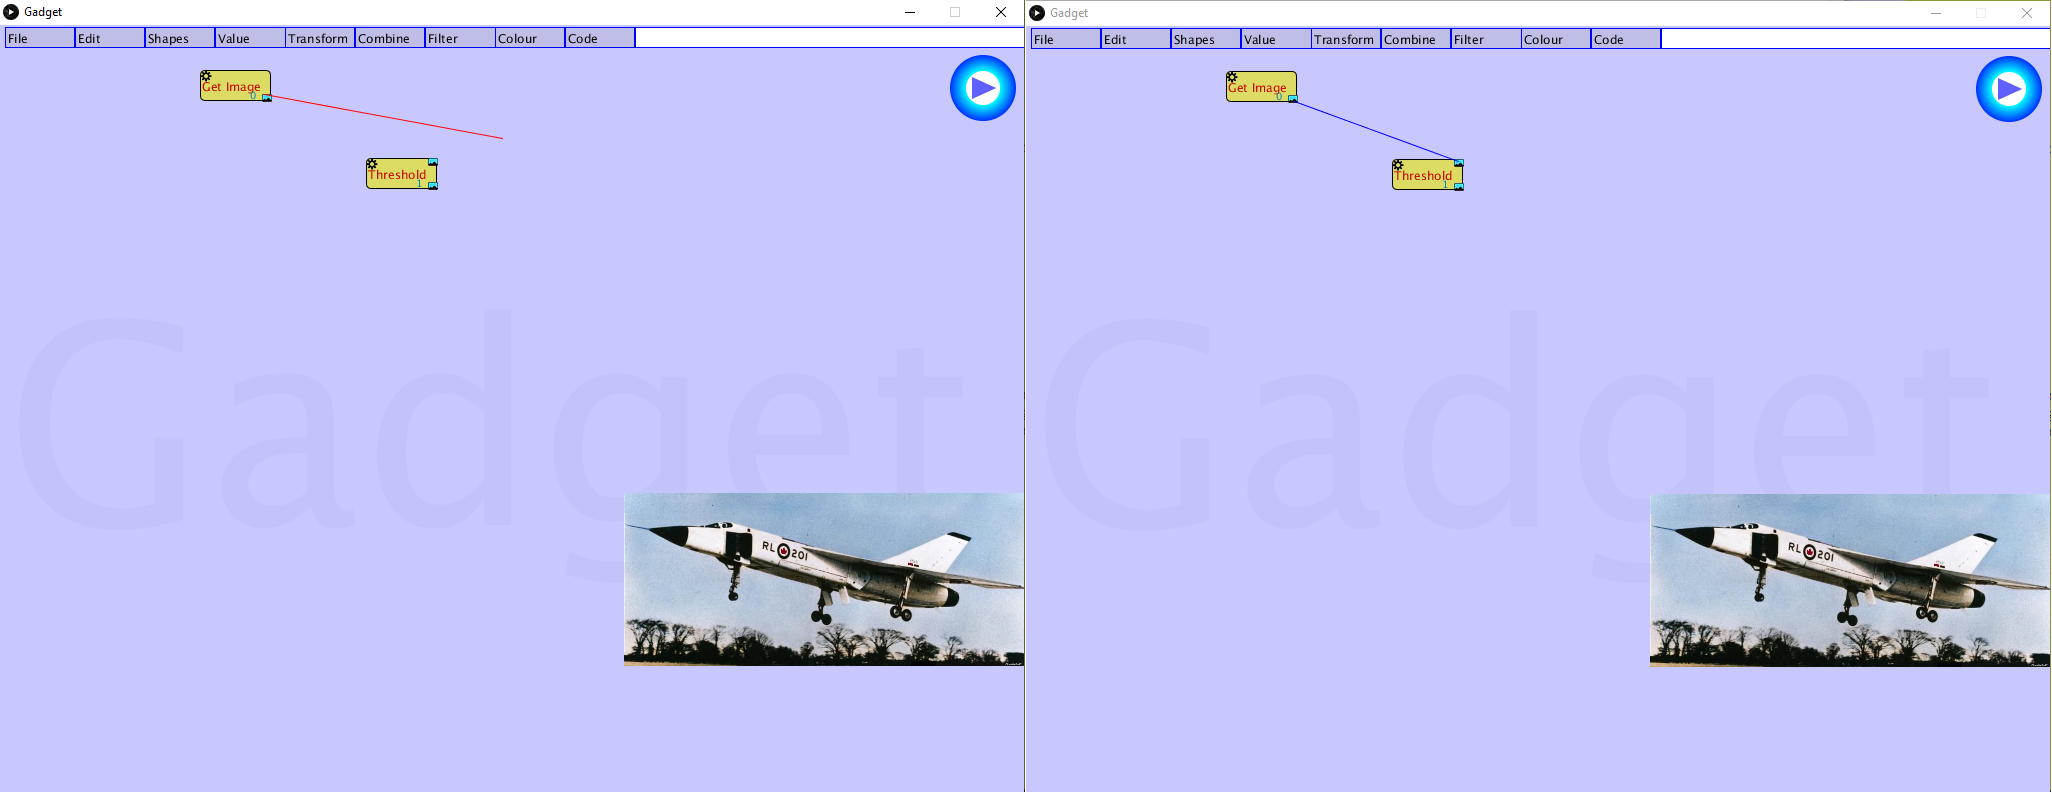
To apply this node (threshold) to the image, we do the following:
1. Place the mouse cursor over the output connector on the "Get image" node.
2. Press down the left mouse button and hold it down.
3. Draw the mouse so the cursor rests over the blue box on the upper right of the "Threshold" node.
This is an input connector, and tells this node which image to operate on. When you do this you will
see a red line connect the output of the "Get image" node to the mouse cursor as you drag it.
4. Release the mouse button. There should be a blue line connecting the "Get image" output to
the "Threshold" input.

Let's see what each menu contains and what the nodes do.
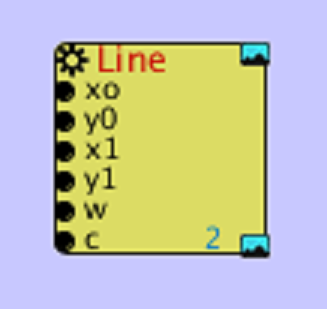 |
This node draws a line. There are six inputs: x0: the x (horizontal) coordinate of the start of the line. A number. y0: the y (vertical) coordinate of the start of the line. A number. x1: the x (horizontal) coordinate of the end of the line. A number. y1: the y (vertical) coordinate of the end of the line. A number. w: the width of the line, in pixels, between 0 and 16. A number. c: the colour with which to draw the line. A colour (r,g,b). |
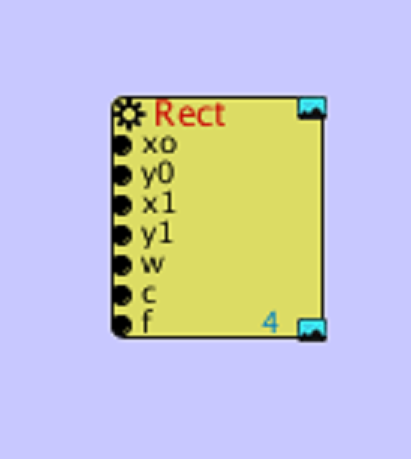 |
This node draws a rectangle. There are seven inputs: x0: the x (horizontal) coordinate of the upper left of the rectangle. A number. y0: the y (vertical) coordinate of the upper left of the rectangle. A number. x1: the x (horizontal) coordinate of the lower right of the rectangle. A number. y1: the y (vertical) coordinate of the lower right of the rectangle. A number. w: the width of the line, in pixels, between 0 and 16. A number. c: the colour with which to draw the line. A colour (r,g,b). f: the color with which to fill the rectangle. |
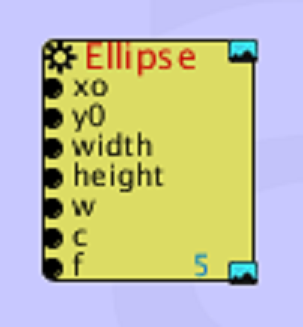 |
This node draws a triangle. There are nine inputs: x0: the x (horizontal) coordinate of the upper left of the ellipse. A number. y0: the y (vertical) coordinate of the upper left of the ellipse. A number. x1: the x (horizontal) coordinate of the lower right of the ellipse. A number. y1: the y (vertical) coordinate of the lower right of the ellipse. A number. w: the width of the line, in pixels, between 0 and 16. A number. c: the colour with which to draw the lines. A colour (r,g,b). f: the color with which to fill the ellipse. |
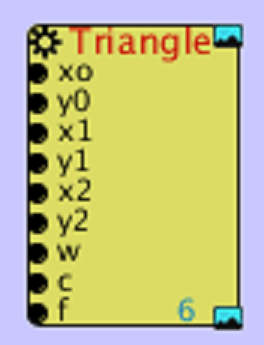 |
This node draws a triangle using three points. There are nine inputs: x0: the x (horizontal) coordinate of the first point. A number. y0: the y (vertical) coordinate of the first point. A number. x1: the x (horizontal) coordinate of the second point. A number. y1: the y (vertical) coordinate of the second point. A number. x2: the x (horizontal) coordinate of the third point. A number. y2: the y (vertical) coordinate of the third point. A number. w: the width of the line, in pixels, between 0 and 16. A number. c: the colour with which to draw the lines. A colour (r,g,b). f: the color with which to fill the triangle. |